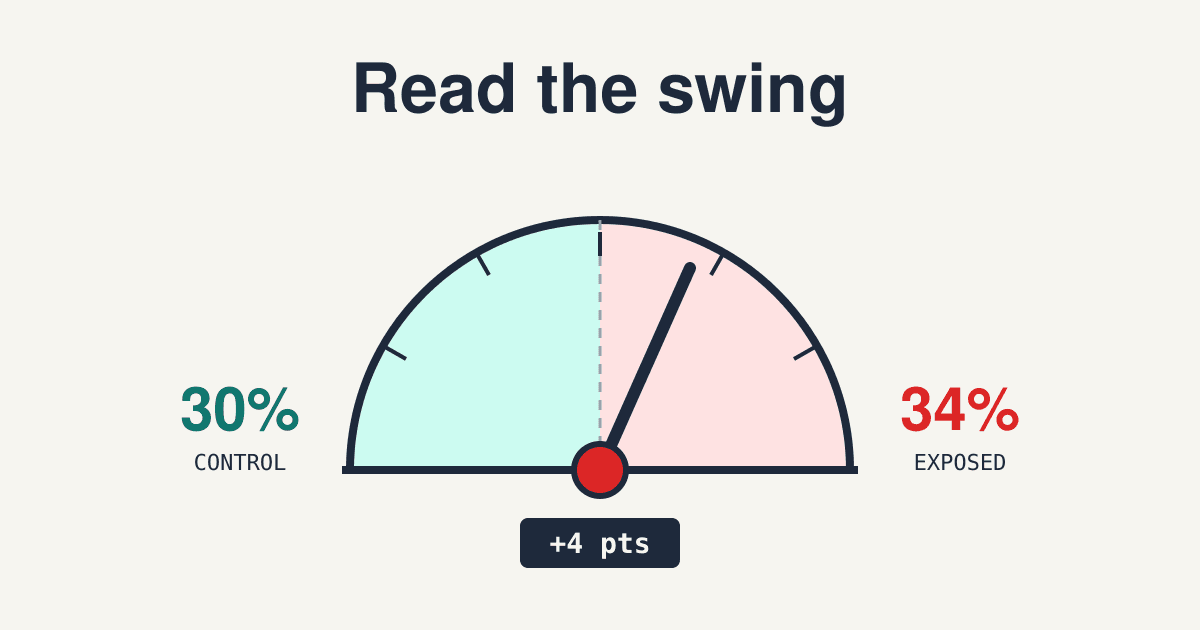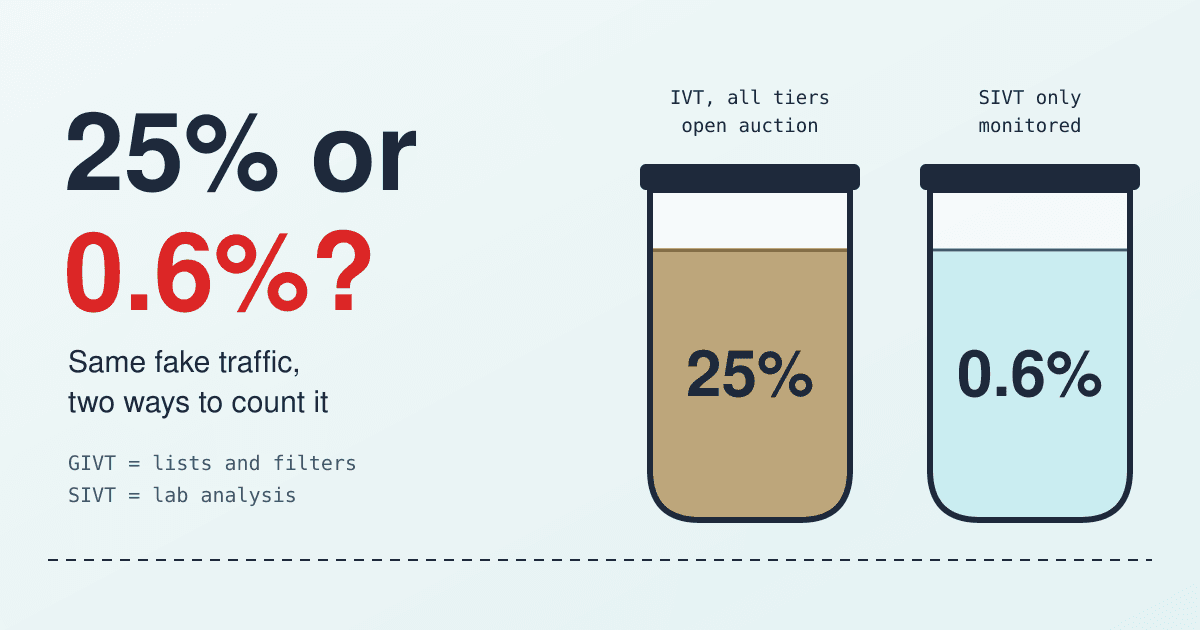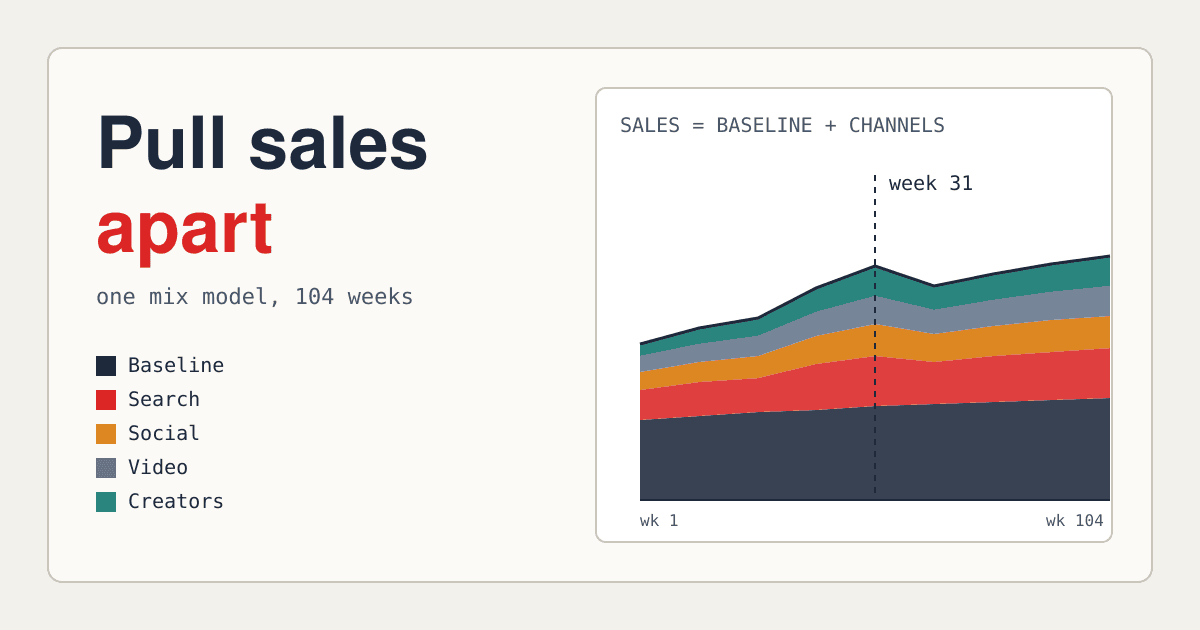
In week 31 sales rose 12% and four dashboards each claimed the credit. The numbers here are made up, but the argument is one most buyers have sat through: search says it closed the sale, the social platform says it did, the video report says the same, and the sum of the claims is larger than the bank deposit.
A marketing mix model settles that argument from the other side. It ignores who clicked what and fits one equation to your own weekly history, sales on one side and spend by channel, price, promotions and season on the other. This page covers what that takes, what comes out, and how to decide whether to trust it. The tool facts come from the Meridian and Robyn documentation, linked where they appear; every dollar and percent figure in the worked examples is invented to show the arithmetic.
What a mix model does with one sales line
The model splits each week of sales into parts: a baseline of what you would sell with no paid media at all, plus a contribution from each channel. The baseline holds trend, seasonality and holidays; the channel parts hold what spend added on top. Because it only needs totals per week, it works without user-level tracking. Meta's Robyn guide lists this as a reason MMM is being picked up again: it does not need user-level data and runs off aggregated data, and it measures marketing and non-marketing effects such as price, promotion and seasonality in one analysis.
That picture is also the first test of the model. If the baseline comes out at 5% of sales for a business with years of repeat customers, or at 95% for a brand that lives on ads, something in the inputs is wrong before any channel is judged.
What the model needs before it can run
Most failed projects fail here, not in the modeling. Four requirements come straight from the documentation:
| Part | What to supply | The rule the docs give |
|---|---|---|
| Length | The sales or conversion series, by week, for as long as you have it | A minimum of two years of weekly data; if only monthly data exists, 4 to 5 years. |
| Media | Spend per channel per week (impressions or clicks too, where you have them) | Meridian wants one exposure metric per channel and time period, with spend as the base for ROI. |
| Variation | Weeks with high and weeks with low spend in each channel | If TV spend stays constant, the model has difficulty working out what it did for sales. A channel that never moves cannot be separated from the baseline. |
| Controls | Price, promotions, stock-outs, competitor moves, anything else that shifts sales | Both tools take them. Robyn's Prophet step can estimate trend, season and holidays, so those need no columns of their own. |
There is also a ceiling on how many inputs the history can carry. The Robyn guide's rule of thumb is that the rows should be about 7 to 10 times the number of columns, and no more than 10 times. Worked out: 104 weeks of data supports roughly 10 to 15 columns, so five channels plus a promotion flag and a price column (seven) fits with room to spare. Twenty-six weeks supports two or three, which is why the same guide suggests daily data when only half a year exists.
Do the data work before anything else: one KPI with one definition across the whole period, spend by week with the same week start for every channel, and a note for every week where tracking broke. The campaign tags from the UTM tagging post make spend by channel much easier to reconcile.
Carryover and saturation, the two bends the model puts in
Spend does not act on sales in a straight line, and the model has to allow for two bends. The first is carryover, called adstock: an ad seen this week still works next week. Robyn's guide gives the simplest form, where a decay value of 0.75 means 75% of the impressions in one period carry into the next. With a decay of 0.5 the same arithmetic looks like this for 100 units of spend in week 1:
This is why a model that only looks at same-week spend undercounts a slow channel such as podcasts or video. Robyn also offers shapes beyond this one, including Weibull curves that allow a flexible decay rate and, in one form, lagged effects.
The second bend is saturation: each added unit of spend buys a little less than the one before. Take a channel whose response flattens as spend rises, and add $10,000 four times:
If another channel sits on the first step of its curve, moving one slice from the fourth step of this channel to the first step of that one changes 9 into up to 39. Those response curves are what turns a mix model from a report into a budget tool, and they are the part the test-and-scale split then checks with real money.
What comes out, and how to read each number
Meridian's introduction names the three questions the model answers: the ROI and contribution of each channel, the response curve of each channel, and how to allocate the next budget. Four outputs carry those answers:
Contribution
The share of sales credited to the baseline and to each channel.
Read it as: where the sales came from, as a split that adds to the total. A channel claiming more than the sales line allows is an error in the model, not a win.
ROI with an interval
Sales per dollar for each channel. Meridian reports it with credible intervals.
Read it as: a range, not a point. A channel at 2.1 with a range of 0.4 to 3.8 has not been measured; it has been bracketed.
Response curve
The curve of added sales against spend, per channel.
Read it as: where the next dollar earns most. Only the part of the curve where you have already spent is evidence; the rest is extrapolation.
Budget recommendation
A suggested split that maximizes the outcome under the model.
Read it as: a hypothesis to test in small steps, never a switch to flip. Moves beyond your past spend range sit outside what the data has seen.
The interval deserves most of your attention. Two channels with ROI ranges that overlap cannot be ranked, however the point values line up, and a recommendation built on the gap between them is a recommendation built on noise.
Two free tools, and what each asks of you
Both big platforms publish open-source models, so the license costs nothing. The work is in the data, the setup and the reading. The pages below are the documentation of each:
| Question | Meridian (Google) | Robyn (Meta) |
|---|---|---|
| How it fits the data | A Bayesian model, sampled with the No U-Turn Sampler; its docs recommend GPUs to cut training time | R code that uses ridge regression, which copes with inputs that move together |
| Trend and season | Control variables; you can add Google Query Volume to account for organic brand interest | Prophet splits out trend, seasonality, holidays and weekday effects |
| Weekly or by region | Weekly, ideally by geography; geo-level modeling adds statistical information | Weekly as best practice; daily data is acceptable with extra checks |
| Use of lift tests | Set priors from past experiments; GeoX runs geo experiments to calibrate the model | Calibrate with Conversion Lift or GeoLift results |
| Who it is written for | Modelers; its partners page lists certified partners that help deploy it | The docs say it is for in-house and DIY modelers |
Without a data team, the honest reading of that last row is that someone has to run notebooks or R code and judge the fit. Doing it yourself is realistic for an analyst-minded buyer with clean data; otherwise hire a partner for the first model and keep the inputs in house, so the second refit costs a fraction of the first.
The check that decides whether to believe it
A mix model is a correlation fitted to history, and several different models can fit the same history about equally well. Both tool guides therefore say to anchor it with experiments. Robyn's guide says it strongly recommends calibrating with experimental and causal results treated as ground truth, such as lift or geo studies, and Meridian's GeoX exists for the same reason. The lift-test side is covered in the incrementality testing post. Then apply one rule per channel:
Agree
The model's ROI for the channel lands inside the lift test's interval.
Keep the model for that channel and re-read it after the next refit.
Disagree
The model's ROI lies outside the test's interval.
Believe the test. Feed its result back in as a prior or calibration and refit; a model that cannot reproduce a clean test has not earned the channels no test has covered.
No test yet
The channel has never had a holdout or geo test.
Test the channel with the largest slice of spend, or the one with the most surprising ROI, before moving budget on its model number.
This rule is our own, not a standard: the documentation says to calibrate, not how to score agreement. It is cheap to apply, because a test that already ran for another reason costs nothing extra to compare.
When to wait before building one
A model run on weak inputs still returns confident-looking charts, so the useful skill is knowing when not to start. Run down these lines first:
| Condition | Ready when | Not yet when |
|---|---|---|
| History | 104 or more weeks of weekly data | Under a year, or monthly data only with fewer than 4 years |
| Spend pattern | Each channel has clearly higher and lower weeks | Spend has stayed flat for the whole period |
| Inputs | Rows are at least 7 times the number of columns | More channels and controls than the history can carry |
| KPI | One definition for the whole period | Tracking or product changes split the series |
| Experiments | At least one lift or geo test on a large channel | No test, and no plan for one |
If a row says not yet, the cheaper step is a test, not a model: the attribution window post shows why platform numbers disagree, and one clean holdout answers more than a model built on twelve months of flat spend.
Questions buyers ask about mix models
Is there a minimum budget for a mix model?
Neither the Robyn nor the Meridian pages I read name one. They name data: length, variation and volume. A small advertiser with two years of weekly history and spend that moves can fit a model; a large one with flat spend cannot.
How is this different from multi-touch attribution?
Robyn's guide says multi-touch models depend on online signals, while a mix model runs on aggregated data such as campaign-level totals. A mix model also counts offline channels, price and promotions that attribution cannot see.
Do I need a data scientist?
You need someone who can run the tool, check the fit and read the intervals. Robyn is written for in-house and DIY modelers and Meridian lists partners for teams that want help, so the choice is between learning it and hiring it for the first run.
Can the model replace my lift tests?
No. Both guides tell you to calibrate it with experiments. The model covers every channel at once from history; tests give a clean answer on one channel at a time. Use the tests to keep the model honest.