In March 2012 eBay switched off its brand-name search ads on Yahoo and MSN, and 99.5% of the clicks it stopped paying for arrived anyway through the free listings.
You can run the same check on any campaign. Hold your ads back from a random slice of your audience, and whatever that slice still buys is what you would have sold anyway. The gap between that slice and everyone else is the only sales figure your ads can honestly claim. Measuring it is an incrementality test, also called a holdout test or a lift test. Divide the revenue in the gap by what you spent and you have incremental ROAS (iROAS), the number to set budgets with.
What does an incrementality test measure?
It measures cause. Attribution answers a different question: which ad stood nearest the sale. Ads are aimed at people already likely to buy, so an ad and a sale often appear together with neither causing the other.
Farmers hit the same problem a century ago. A rich corner of a field makes any fertiliser look good, so in 1926 the statistician R. A. Fisher, working at the Rothamsted station in England, set out how to arrange a trial: split the field into plots, repeat each treatment across them and let chance decide which plot gets what. Chance is what makes the comparison fair, because it spreads the rich soil evenly across both sides. The picture at the top of this page is that design. Swap plots for people or regions and fertiliser for ads, and you have a lift test.
The three words every report uses:
- Lift
- How much higher the test group's conversion rate is than the control group's, as a percentage.
- iCPA
- Spend divided by incremental conversions: what one extra sale cost.
- iROAS
- Incremental revenue divided by spend. Break-even is 1 divided by your margin: a 40% margin needs 2.50.
Holdout, ghost ads or geo: which trial design fits?
Pick by what you can randomise. People give the sharpest answer. Regions work everywhere, including offline. Meta's GeoLift documentation recommends people-based tests where they are possible because they have more statistical power.
User holdout
Split: people, at random, into a group that can get the ad and a group that cannot.
Read: compare the whole groups. Meta calls this intent to treat: everyone assigned to test counts, whether or not an ad reached them.
Weak spot: Google's guide warns that it relies mostly on opt-in traffic, so measurement gaps can affect it.
Ghost ads
Split: people again, but the platform also logs when a control person would have been served your ad.
Read: compare the people who were reached with their control counterparts, which removes the noise from everyone the campaign never touched.
Weak spot: only the ad platform can run it, so you take its logs on trust.
Geo experiment
Split: non-overlapping regions, assigned at random, ideally after matching them in similar pairs.
Read: compare sales by region, from your own books. Online and offline sales both count.
Weak spot: Google calls this split noisier, with no demographic slices and a budget that tends to be higher.
Skip the charity ad. Showing the control group a public service ad used to be standard, but ad delivery systems optimise toward who responds. The people shown the charity ad are then not the people who would have seen yours, which is what ghost ads were built to avoid.
How many people does a lift test need?
Fewer than you fear for a big lift, and far more for a small one. The rule of thumb: each group needs about 16 divided by the lift squared, in conversions. A 10% lift (0.10) needs 16 / 0.01 = 1,600 conversions per group. A 5% lift needs 6,400.
The table turns that into people, for two equal groups at 80% power and 5% significance. We calculated it with the standard two-proportion formula. Read the row for your conversion rate over the test window.
| Conversion rate | 5% lift | 10% lift | 20% lift | 50% lift |
|---|---|---|---|---|
| 0.1% | 6.4M | 1.6M | 431k | 78k |
| 0.5% | 1.3M | 328k | 86k | 16k |
| 1% | 637k | 163k | 43k | 7.7k |
| 2% | 315k | 81k | 21k | 3.8k |
| 5% | 122k | 31k | 8.2k | 1.5k |
Plan for the left-hand columns. Across 663 Facebook experiments, the median measured lift on lower-funnel outcomes was 5%. Unless you have a reason to expect more, size the test for a small effect.
Unequal groups cost more in total: a 90/10 split needs about 2.8 times the people of a 50/50 split for the same precision, and 95/5 about 5.3 times.
How do you run the trial, week by week?
Most ruined tests are ruined before launch or by someone peeking in week two. Write the plan down first.
- Week -4
Write the decision before the test
One sentence: "If iROAS is above 2.50 we keep the budget, below it we cut 30%." Name the single conversion that counts and where it is counted.
- Week -3
Size it
Use the table above with your real conversion rate. If the audience or budget is too small, test a bigger region or a whole channel instead of one ad set.
- Week -2
Check the split
Randomise, then compare both groups on the weeks before launch. Their sales should track each other. If they do not, redraw now, while it costs nothing.
- Weeks 1 to 4
Leave it alone
Run whole weeks and at least one full purchase cycle. For scale, the median Facebook experiment in that same study ran 30 days. Hold creative, bids and budget steady, and do not launch a sale in only one group.
- Weeks 5 and 6
Wait for late buyers
Keep counting conversions after the ads stop. A $900 product bought after a two-week think will be missing from a report pulled the day the campaign ends.
- Week 6
Read it once
Open the result on the planned date and apply the sentence from week -4.
Worked example: the 5.00 ROAS that loses money
An invented online shop, with round numbers so you can follow the sums. Average order $50, gross margin 40%, audience of 2,000,000, split 90/10. The campaign spends $60,000 over four weeks.
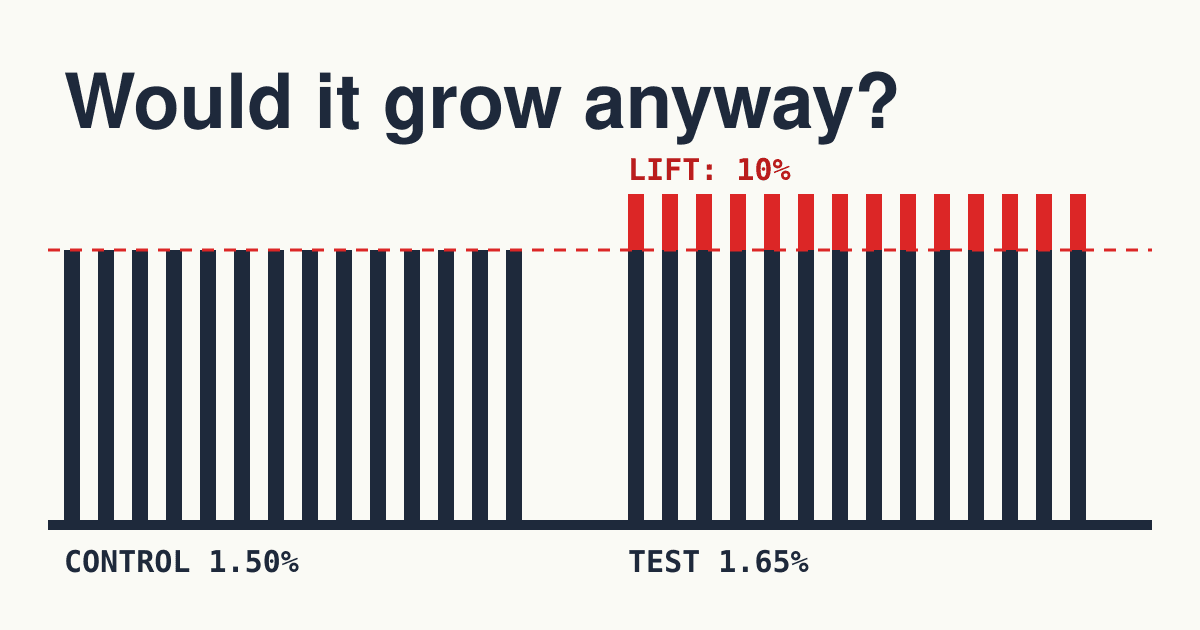
- Control group rate
3,000 / 200,000 = 1.50% - Test group rate
29,700 / 1,800,000 = 1.65% - Lift
(1.65 - 1.50) / 1.50 = 10% - Sales expected with no ads
1,800,000 x 1.50% = 27,000 - Incremental purchases
29,700 - 27,000 = 2,700
Meanwhile the ad platform attributes 6,000 purchases to the campaign, because many of those 27,000 people clicked or saw something on their way to buying anyway. Here are the same four weeks in two reports:
| $60,000 spend | Platform report | Trial result |
|---|---|---|
| Purchases | 6,000 | 2,700 |
| Revenue | $300,000 | $135,000 |
| Return on ad spend | 5.00 | 2.25 |
| Cost per purchase | $10.00 | $22.22 |
| Gross profit at 40% | $120,000 | $54,000 |
| After paying for media | +$60,000 | -$6,000 |
The trial credits 45% of what the platform claimed (2,700 / 6,000). That ratio is the most useful thing the test leaves behind: until the next trial, multiply this campaign's in-platform numbers by 0.45 before you compare them with anything else.
Why a significant lift can still leave the decision open
That 10% lift is rock solid: a z-score of 5.2, far beyond any significance threshold. It is also not enough to act on, because the question was never "did the ads do anything?" It was "did they beat 2.50?" Here is the 95% confidence interval on iROAS for the same campaign at three splits, keeping spend per test person the same.
95/5 split iROAS 1.09 to 3.41
Could be a clear loser or a clear winner.
90/10 split iROAS 1.40 to 3.10
The test as run. Still straddles break-even.
50/50 split iROAS 1.73 to 2.77
Far tighter, and it still crosses 2.50.
At 50/50, getting the top of the range below 2.50 means cutting the margin of error from 0.52 to 0.25, which takes about four times the data. This is the finding of Lewis and Rao: sales per person swing so much compared with ad cost that the median confidence interval on ROI across their 25 experiments was over 100 percentage points wide.
So read the whole range against break-even, not the headline:
| The iROAS range is | Do this |
|---|---|
| Entirely above break-even | Keep the budget, then test a bigger one: the next dollar usually earns less than the average. |
| Entirely below break-even | Cut, unless repeat purchases pay it back. Show that with customer data, not hope. |
| Straddling break-even | You know the limits, not the verdict. Trim the budget toward what the estimate suggests and rerun bigger. |
| Wide and touching zero | The test failed, not the ads. "No significant lift" from a small test proves nothing. |
What have past trials found?
Enough to doubt attribution, and not enough to assume every channel is overrated.
-63%
eBay, non-brand paid search, 2014
Blake, Nosko and Tadelis calculated an ROI of over 1,400% from observational data. The experiment found -63%, with a 95% interval of -124% to -3%. This is the same paper as the brand-term test at the top of the page.
100+
Percentage points of doubt, 2015
Lewis and Rao ran 25 large experiments with US retailers and brokerages. Informative tests could need more than 10 million person-weeks.
24 vs 5
Facebook, 663 experiments, 2022
Gordon, Moakler and Zettelmeyer tried to recover trial results from observational data with over 5,000 user features. On lower-funnel outcomes, the median lift was 5% by trial and 24% by the better of the two models.
+23%
Rocket Mortgage, reported by Google
Lift can run the other way. A demand generation test showed 23% more value than the company's model had estimated. This is a vendor's case study, and the point stands: the test tells you which way you were wrong.
What spoils a lift test?
Exposed vs unexposed
Sign: You compare people who saw the ad with people who did not, and the lift looks huge.
Treatment: That is the bias you came to remove. Compare groups as assigned at random.
Early harvest
Sign: Someone checks daily and stops when the number looks good.
Treatment: Fix the end date in advance. Repeated checks inflate false positives.
Spillover
Sign: A control region lifts too: shoppers commute, or national TV reaches it.
Treatment: Use larger regions with little travel between them and exclude border areas.
Mid-trial meddling
Sign: A new creative or sale lands in one group during the test.
Treatment: Freeze changes, or restart. The result now measures something else.
One-off weeks
Sign: The test sits on Black Friday or a stock-out.
Treatment: Avoid shocks, and do not assume peak-week lift holds in a normal month.
Marking your own homework
Sign: The only lift numbers you hold come from the seller of the media.
Treatment: Run a geo test on your own sales now and then. It needs no platform data.
Selling the media? Offer the holdout yourself
Publishers and creators gain the most here, because last-click attribution tends to credit the final search or retargeting ad and leaves the placement that started the idea with little. A seller who proposes a clean test looks confident and may recover credit that a dashboard never gave them. These tests are practical without an ad platform:
- Newsletters: randomly leave 10% of the list out of the sponsored send, then have the advertiser match both lists against buyers.
- Podcasts and audio: with dynamic ad insertion, withhold the spot in matched regions.
- Creators: a post cannot be held back, but paid amplification of it can run in some regions and not others.
- Sites: run a sponsorship in chosen countries or regions for a set period, and leave matched ones out.
Agree the conversion and the decision rule before the campaign. Small audiences will give wide ranges, so show the advertiser the table in plot 4 first.
Questions buyers ask
What is the difference between incrementality and attribution?
Attribution shares out credit for sales that happened. Incrementality measures how many would not have happened without the ad. Google positions them alongside marketing mix models: attribution maps the journey, experiments give the causal reading for a campaign or channel, and a mix model covers all channels and outside factors, and can be calibrated with the experiment.
What is a good iROAS?
Anything above 1 divided by your gross margin, so 2.50 at a 40% margin and 1.25 at 80%. No outside benchmark beats that sum. Add repeat purchase value if you have measured it.
Can a small advertiser run an incrementality test?
More easily than before. In 2025 Google cut the minimum from as much as $100,000 to $5,000, though Conversion Lift is not on every account and access goes through your Google representative. Below that, run a simple geo test by hand. It will be noisy, so test whole channels, where the effect is big enough to see.
How is this different from an A/B test of two ads?
An A/B test compares two ads against each other and tells you which is better. A lift test compares ads with no ads and tells you whether either was worth buying. The better of two ads can still lose money.
Does the holdout cost me sales?
Only the incremental ones, and only if the ads work. In the worked example, 10% of the audience saw no ads, so the shop gave up about 300 purchases and saved the media spend for those people. That is the price of knowing.
How often should I rerun a test?
When something large changes: budget, audience, creative approach, or season. A result is a reading at one point in time, not a permanent property of a channel. Start with your biggest budget line and work down.
Sources
- R. A. Fisher, The arrangement of field experiments, 1926
- Blake, Nosko and Tadelis, Consumer Heterogeneity and Paid Search Effectiveness, NBER 2014
- Lewis and Rao, The Unfavorable Economics of Measuring the Returns to Advertising, QJE 2015
- Johnson, Lewis and Nubbemeyer, Ghost Ads, Journal of Marketing Research 2017
- Gordon, Moakler and Zettelmeyer, Close Enough?, 2022
- Vaver and Koehler, Measuring Ad Effectiveness Using Geo Experiments, Google Research
- GeoLift documentation, Meta
- About Conversion Lift, Meta Business Help
- About Conversion Lift, Google Ads Help
- Comparing lift types, Google Ads Help
- Incrementality testing improvements, Google Ads Help, November 2025
- How experimentation reveals the true value of marketing, Think with Google, February 2026