Media Buying, 9 min read
Reach and Frequency: How Many Times Should One Person See Your Ad?
Reach counts people, frequency counts repeats, and every budget trades one for the other. The math, what the research says about the right number, and what your average hides.
The same $5,000 at a $25 CPM can show your ad once to 200,000 people or five times to 40,000, because impressions always equal reach times frequency. Reach is how many different people saw the ad; frequency is how many times each of them saw it, on average.
No study has found one right number. Newer results mostly say the first exposure does the most and each repeat adds less, though the newest come from the platforms selling the ads: in 301 Twitter studies, up to 80% of the possible impact on ad recall and brand awareness came within 2 exposures a week, and in a Google-commissioned analysis TV return fell 41% at 6 or more a week. Our starting point for an established brand is a cap of 2 a week. Start higher for a new brand or a short campaign.
What are reach, frequency and impressions?
Think of one loyalty card per person. Reach counts the cards, impressions count the punches, and frequency is the average number of punches per card.
- Reach
- The number of different people who saw your ad at least once. In practice a platform counts accounts: Meta's reach is "the number of Meta Accounts that saw your ads at least once" (Meta).
- Impressions
- The number of times the ad was shown. If an ad is on screen for one person 2 different times in a day, that is 2 impressions (Meta).
- Frequency
- The average number of times each person reached saw the ad. It is "impressions divided by reach" (Meta), so it is never below 1.
- Frequency cap
- A limit you set on how often an ad appears to the same person in a day, week or month (Google Ads). Frequency is what happened; a cap is the ceiling you asked for.
- Gross rating points (GRPs)
- Reach as a percentage of your audience, times average frequency (Washington State University). It sums up how heavy a schedule is, not how many people it touches.
How do you calculate reach, frequency and GRPs?
Five lines cover almost every media plan. The examples use a $5,000 budget, a $25 CPM and an audience of 400,000 people.
- Impressions
budget / CPM x 1,0005,000 / 25 x 1,000 = 200,000 - Frequency
impressions / reach200,000 / 40,000 = 5.0 - Reach %
reach / audience x 10040,000 / 400,000 x 100 = 10% - GRPs
reach % x frequency10 x 5 = 50 - Two channels
1 - (1 - a) x (1 - b)40% and 30% give 58%, not 70%
The last line estimates combined reach when seeing one channel tells you nothing about seeing the other (Mediaocean). Real audiences overlap in less tidy ways, so treat it as a first estimate.
Here is the trade-off on that budget. Every row buys the same 200,000 impressions and the same 50 GRPs, which is why GRPs alone cannot tell you which plan you bought.
| Frequency | People reached | Share of audience | GRPs |
|---|---|---|---|
| 1 | 200,000 | 50% | 50 |
| 2 | 100,000 | 25% | 50 |
| 3 | 66,667 | 16.7% | 50 |
| 5 | 40,000 | 10% | 50 |
Why does reach stop growing when you spend more?
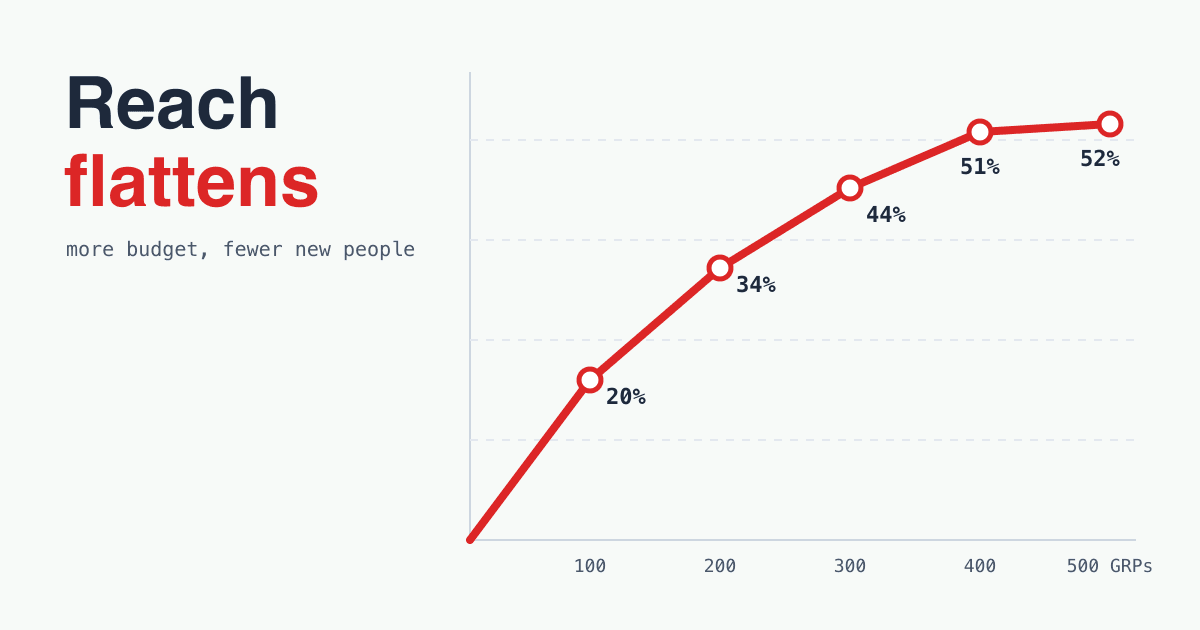
Each new impression is more likely to land on someone you already reached, so a bigger budget buys repeats rather than new people. Nielsen's predicted curve for digital campaigns aimed at Canadian adults aged 25-54 shows the shape: going from 100 to 200 GRPs lifts reach from about 20% to 34%, a 70% rise, while going from 400 to 500 adds only 2%.
Delivery is also far from random. If 100 GRPs landed evenly at random, a Poisson model (which a Nielsen patent calls an industry standard) would put reach near 63%, or 1 minus e to the power of -1. That figure is our calculation. Nielsen's curve predicts about 20%, which means about 5 impressions per person reached. The gap is the repeat exposure a plan pays for without choosing it.
Once the curve goes flat, stop adding budget to that audience. Add a new audience or channel instead, or keep the money.
How many times should one person see an ad?
No study gives one number, because each one measured something different. Older TV work settled on about three. Most newer work says the first exposure is worth the most, and each repeat is worth less but still something. The figure beside each study is its answer to "how many?"
-
3
Krugman, 1972
Three psychological exposures: "What is it?", "What of it?", then a reminder. He was describing attention, not media counts, and said someone who enters the market months later may take the twenty-third exposure "as if it were the second" (quoted in Naples, 1979).
-
3+
Naples, ANA, 1979
"At least three exposures within a purchase cycle", from a pre-digital evidence review. It also says "there must be experimentation with each brand" (Effective Frequency).
-
1
Jones, 1995
From household purchase data, the first exposure in the week before purchase had the biggest effect and further exposures added very little, so reach beat frequency (summarised by Batra and colleagues, 1995).
-
Last
Ephron, 2002
"The exposure that triggers a response is not the first exposure, but the most recent of a series of exposures" (Ephron). His advice: reach more people across more weeks, because you cannot know who is in the market this week.
-
1-50
Lewis, 2010
On the Yahoo Front Page, measuring clicks and sign-ups, "some campaigns exhibit significant decreasing returns to scale after one or two impressions while others show constant returns to scale even after fifty impressions" (MIT thesis).
-
2/wk
X and Nielsen, 2020
In 301 US brand studies, "up to 80% of the overall potential impact on Ad Recall and Brand Awareness occurs within the first 2 exposures per week" (X for Business). Vendor data.
-
None
Meta, 2020
Across 2,439 Brand Lift campaigns there is "typically a point of diminishing returns", but "no one-size-fits-all frequency", and weak creative reaches its plateau sooner (Meta). Vendor data.
-
6/wk
Google and Nielsen, 2022
In 14 US packaged-goods studies commissioned by Google, TV return fell 41% at 6 or more impressions a week, a range that held 46% of TV impressions served (Google). Vendor data, and the vendor sells the alternative.
-
1
Martín and Pérez, 2026
Two practitioners writing in their own newsletter argue that, for efficiency, "the optimal is to deliver the message to a new person", and that every impact adds some purchase probability with "no tipping point" (Quantified Nation 20). When the goal is total effect, they add, more frequency is usually right. Their opinion, from a simplified model, and their bios list Google roles (Martín, Pérez).
What the newer studies share: each repeat adds less than the one before, but repeats are not worthless. The older TV work disagrees about the first exposure, since Naples found one exposure alone did little. Either way, the answer moves with the creative, the brand and the buying cycle.
"People need to see an ad 7 times."
We found no study behind the rule of 7. It is repeated widely, without a source.
"Three exposures is proven."
Krugman's three were stages of attention. Naples's "at least three" came from a 1979 review of pre-digital studies, measured inside a purchase cycle.
"Repeats wear out at the same point for everyone."
Wear-out comes sooner for unfamiliar brands and for weak creative. In a restaurant-search experiment, ads spread apart beat ads bunched together.
What does an average frequency hide?
It hides who took the repeats. These two campaigns report exactly the same numbers: reach 5, impressions 15, frequency 3.0.
Campaign A: even
- A3
- B3
- C3
- D3
- E3
Everyone is at 3.
Campaign B: skewed
- A1
- B1
- C1
- D2
- E10
Three people saw it once. One saw it 10 times, two-thirds of the spend.
Real delivery can look a lot like B. Two published examples, both from vendors:
- 77xAverage frequency for the 20% of households that took 81% of connected TV impressions in political ads, while the other 80% averaged 4.5x. Source: MiQ data, 2024, 9.2 million connected TV and linear devices.
- 60%+Share of linear TV ad impressions going to the 20% of households that are heavy viewers, across four markets. Light viewers are 45% of households and get 5%. Source: Samba TV, Q4 2021.
So read the spread, not the average. Google Ads has a frequency distribution view for video campaigns, and TikTok's Reach & Frequency campaigns have a Frequency Breakdown Report.
Do not panic if a report shows more than your cap. Check the date range first: Google notes that a 3-a-week cap read over 2 weeks "may find up to 6 impressions per person". The same page says caps are "applied by cookies", so one person on two browsers can pass it (Google Ads). Display & Video 360 counts only viewable display impressions towards a cap, while its reports may count unviewable ones too (Google).
Where do you set frequency on each platform?
Each platform below reports estimated or modelled reach in its normal reports, and each offers different controls. Checked on 2026-10-30.
| Platform | What reach counts | The control | Watch for |
|---|---|---|---|
| Meta | Accounts; estimated from sampled data | In reservation buying, target frequency or a frequency cap; the cap defaults to 2 impressions every 7 days | Reservation is for audiences above 200,000; delivery is not 100% guaranteed. Auction ad sets may have their own settings, so check yours |
| Google Ads | Modelled unique users, not cookies, across devices | Caps in Display and Video campaigns, per day, week or month; Target frequency for video, 2-7 a week by format | Not supported in Demand Gen. Target frequency is not a cap. Reach data typically takes up to 3 days |
| Display & Video 360 | Modelled unique reach | Exposures per time period | Google's help page sets the longest cap period at 30 days after February 28, 2025 |
| TikTok | User accounts; estimated from sampling | Frequency cap in days on Reach, Reach & Frequency and some video views buys; target frequency as a weekly average | Exact reach appears in the Frequency Breakdown Report, for the Reach & Frequency buying type |
| Member accounts; modelled, not exact | Frequency cap of 3 to 30 impressions per 7 days, on brand awareness ad sets, still rolling out | The lowest cap is 3, so 2 a week is not available, and delivery can pass the cap |
Newsletter issues, podcast episodes and creator posts have no cap button: the number of insertions is the ceiling. Four insertions in a 50,000-subscriber newsletter is 200,000 sends, but reach can never pass 50,000. Ask the seller for unique reach across the whole run, not just the total.
How do you find the right frequency for your campaign?
Start low, then let your own results raise the number. The 2-a-week start and the 6-a-week alarm are our judgment from the studies above, not a published standard.
- Set the window to the buying cycle. Frequency only means something over a period. Use a week for things people buy often and a month for slower purchases, as Naples's "within a purchase cycle" suggests.
- Start at 2 a week for an established brand. Meta says brands with high awareness can limit ads to "one or two times each week", and 2 is the lowest weekly Target frequency Google supports. For a new brand or a short campaign, start higher: Meta says "a high-frequency strategy may be beneficial". Treat 6 a week as an alarm.
- Spread delivery across the flight. Ephron's case for more weeks and the restaurant-search result both favour spacing over bursts. Avoid a schedule that spends the whole budget in a few days.
- Bring enough creative. Google says to add at least as many creatives as your Target frequency number, to avoid fatigue.
- Read the distribution every week. Look for people far above the average, and heed Meta's warning: if performance drops as frequency rises, change the creative or the targeting.
- Test before you raise it. Split an audience between two caps, keep a group that sees nothing, and compare the outcome that matters. Small tests stay noisy: in 25 experiments at large US retailers and brokerages, measuring sales return reliably took a sample "typically in excess of ten million person-weeks", so read a small result as a direction, not a verdict.
Reach and frequency questions
What is a good ad frequency on Facebook and Instagram?
Meta gives no target. It says frequency "may average 1 to 2 per ad set or may be much higher", depending on budget, audience size and schedule. Watch performance: a drop as frequency rises may mean ad fatigue.
Is reach the same as impressions?
No. Reach counts different people once each; impressions count every showing. An ad seen 3 times by each of 1,000 people has a reach of 1,000 and 3,000 impressions.
Is frequency the same as a frequency cap?
No. Frequency is the average you got. A cap is the limit you set, and Google's Target frequency is neither: it aims at an average, so some people see the ad more often than the target.
Is the rule of 7 real?
We found no study behind it. Sourced results run from one exposure close to purchase to at least three in a buying cycle, and they vary by campaign.
How do I work out frequency without a platform report?
Divide impressions by unique reach. If a seller gives you only impressions, you cannot work it out, so ask for unique reach.
Sources
Platform pages were read on 2026-10-30.
- Meta: About Reach Metrics, Impressions, Frequency, Glossary of Reservation Terms, Frequency controls, About Reservation
- Google Ads: Frequency capping definition, Use frequency capping, Measuring reach and frequency, About frequency distribution, About Target frequency
- Display & Video 360: Manage frequency, Measuring reach and frequency
- TikTok: About the Reach metric, About frequency cap, About target frequency; LinkedIn: Delivery metrics in Campaign Manager, Frequency cap management
- Washington State University: Marketing 505 transcript; Mediaocean: Mixing media; Nielsen: Too Big to Fail?, 2016; Nielsen patent US10504138B2
- Naples: Effective Frequency, ANA, 1979, quoting Krugman; Batra, Lehmann, Burke and Pae, Journal of Advertising Research, 1995; Ephron, letter, 2002; Lewis, MIT, 2010; Lewis and Rao, 2013
- X for Business: Frequency caps; Meta: optimal ad frequency; Google: frequency on YouTube, 2022; Quantified Nation 20, 2026, with the bios of Jesús Martín and Pablo Pérez
- Campbell and Keller, Journal of Consumer Research, 2003; Sahni, Quantitative Marketing and Economics, 2015 and working paper, 2011; Advanced Television on MiQ, 2024; Advanced Television on Samba TV, 2022
Continue Reading
More articles you might enjoy
Media Buying
Incrementality Testing: Run a Holdout and Find Out Which Sales Your Ads Caused
A trial protocol for media buyers: holdouts, ghost ads and geo experiments, how many people each one needs, and a worked campaign whose 5.00 ROAS loses money.
Media Buying
Podcast Downloads Under IAB v2.3: The 1-Minute Rule, the Measurement Window, and What an Ad Buyer Should Ask
A podcast download proves an episode file reached a device, not that anyone played it. How IAB Tech Lab Podcast Measurement v2.3 (September 2026) filters requests into downloads, why certified hosts can disagree, and what to ask before you buy podcast ads on a CPM.
Media Buying
Newsletter Sponsorship: What to Pay and How to Vet the List
What newsletter ads cost in 2026, why open and click counts overstate what you get, and the six questions to ask a publisher before you book.