Put the same multiple-choice question in front of two crowds, one that saw your video and one that was quietly held back, and the gap between their answers is the only thing a brand lift study sells you. Everything else on the report, from lifted users to cost per lifted user, is arithmetic on that gap. So the two things worth your attention are whether the crowds were really alike before the ad ran, and whether enough people answered for the gap to be more than noise.
Exit poll: the short version
A brand lift study is a survey experiment, not a sales report. It measures memory and attitude (ad recall, awareness, consideration, purchase intent), compares the people who saw the ads with a randomly withheld control group, and reports the difference. Small differences need many answers: Google's own table asks for 1,200 to 2,800 responses to detect a lift above 4 points, and 20,000 to 45,000 for a 1-point lift. Read absolute lift and the confidence range first, relative lift last.
- 2,000responses per metric before a high-performing campaign can expect a detected lift (Google Ads Help)
- 4,100responses per metric at the recommended budget minimum (Google Ads Help)
- 16,800responses per metric with no lift shown: Google says you may not be able to detect one
How the exposed and control groups are built
Google describes its Brand Lift surveys as being shown to two groups: people who have seen your ads, and people who were eligible to see them but did not, because the ad was not shown (Google Ads Help, About Brand Lift). The second group is the control. It matters that its members were eligible: they match your targeting, they were in the same auctions, and the only planned difference is the ad. That is what makes the gap a measure of the ad rather than a measure of who you targeted.
The survey itself is short. On YouTube it appears before a video starts and offers your brand plus up to three competitor names as answers (Google Ads Help, Set up Brand Lift). Every answer is one ballot in one box, and only the answers count: the size of the audience does not.
The control can break without warning
Google warns that a study whose campaigns target people who already watched the ad video, such as a remarketing list or a later step of a video ad sequence, cannot build a control group: progress shows on the exposed side only and no results post (Google Ads Help, Lift measurement statuses and metrics). Keep remarketing out of a campaign you want to weigh.
Not every vendor builds the control this way. A study that compares people your campaign reached with people it simply missed is comparing two different audiences, and the gap can be the targeting, not the ad. Ask any seller of a lift study one question before you sign: how was the control group chosen, and was it chosen before the campaign ran?
Which metrics a study measures: awareness, consideration, intent
A lift study measures what a person says, at one moment, about your brand. Google's setup lets you pick up to three metrics per study from this list: ad recall, awareness, association, consideration, favorability, purchase intent and a custom metric; all are multi-select questions except purchase intent, which is single-select (Google Ads Help, Set up Brand Lift). Three of them map to the classic stages of a brand funnel:
-
AwarenessWhich of these brands have you heard of?
Exposed41%
Control36%
+5 pts
-
ConsiderationWhich would you consider next time you buy?
Exposed22%
Control19%
+3 pts
-
Purchase intentWhich are you most likely to buy?
Exposed12%
Control11%
+1 pts
Worked example with invented numbers, to show the shape of a typical readout; the question wording is ours, not a platform's. Each row is one metric asked of its own sample.
In the example the gap shrinks from 5 points to 1 down the funnel, and that shape is the reason to pick metrics with care: whatever metric you choose, a smaller gap needs many more answers to be told apart from noise (next section). Purchase intent is the metric a sales team wants; if its gap is 1 point, it needs tens of thousands of responses. Choose the metric that matches what the campaign was built to do, and size the study for the gap you can realistically expect on it.
Minimum sample sizes: how many answers a lift needs
Google publishes the response counts it needs, in total across both groups, to report a given absolute lift (Google Ads Help, Lift measurement statuses and metrics):
- Above 4 pts 1,200 to 2,800
- 3 pts 2,800 to 5,000
- 2 pts 4,100 to 11,000
- 1.5 pts 11,000 to 20,000
- 1 pt 20,000 to 45,000
- 0.5 pts 45,000 to 180,000
Bar length is the upper bound of each range on a log scale, from 1,000 to 200,000. Below 0.5 points Google asks for more than 180,000 responses.
The same page adds three working numbers: about 2,000 responses per metric for a high-performing campaign, 4,100 per metric at the recommended budget minimum, and no detectable lift likely if nothing shows after 16,800. Results may appear from 2,000 responses but can swing while the study runs, so Google recommends waiting for the final report. The study allows up to 10 days to meet its budget eligibility and can keep collecting answers for a short period after, usually under 14 days, because the survey follows the impression.
Check it yourself
The table agrees with the textbook formula for comparing two proportions. Our arithmetic, assuming a 30% baseline, 90% one-sided certainty and 80% power: a 4-point lift needs about 1,224 responses per group (2,448 in total), a 3-point lift about 4,319 in total, a 2-point lift about 9,638 and a 1-point lift about 38,219. Each lands inside Google's range. Halve the gap and you need roughly four times the answers.
One practical consequence: every segment you cut the results into (age, device, creative) has its own, smaller sample. Cut a study into four equal slices and each slice can only read a gap about twice as large as the whole study could.
How to read a lift: absolute, relative and headroom
All three lift numbers start from the same two readings, the positive response rate of the exposed group and of the control (which Google calls the baseline). Google's own example uses 20% for the control and 40% for the exposed group (Google Ads Help, Lift measurement statuses and metrics):
-
Absolute lift
exposed - control40% - 20% = 20 pts
The straight gap in percentage points. Read this first.
-
Relative lift
(exposed - control) / control20 / 20 = 100%
The gap as a share of the baseline. Big when the baseline is small.
-
Headroom lift
(exposed - control) / (1 - control)20 / 80 = 25%
The gap as a share of the people who could still be won.
Same campaign, same answers: 20, 100 and 25. A deck that leads with "100% lift" is quoting the most flattering of the three. On a well-known brand with a 60% baseline, the same 20-point gap would be a 33% relative lift and a 50% headroom lift, which is why relative lift cannot be compared across brands with different starting points.
Lifted users and cost per lifted user
Lifted users extends the gap to the campaign's reach: an estimate of how many people changed their answer because of the ads, not a count of unique people. Cost per lifted user divides spend by that number, and Google recommends it as the main success metric because it weighs reach and cost together. Its example: two campaigns spend $100 each; one gets a 10-point lift on 6,666 people (667 lifted users, $0.15 each), the other a 5-point lift on 20,000 people (1,000 lifted users, $0.10 each). The smaller lift is the better buy.
Certainty and the confidence range
Google reports a certainty of lift, defined as 1 minus the p-value, and aims for 90%. Results between 50% and 70% certainty are to be used only directionally, and below 50% the report says "no lift" (Google Ads Help, About certainty of lift). Lift figures come with an 80% two-sided confidence interval, so there is a 90% chance the true lift is above the lower bound. When certainty is under 90%, that lower bound is below zero.
Same gap, two sample sizes
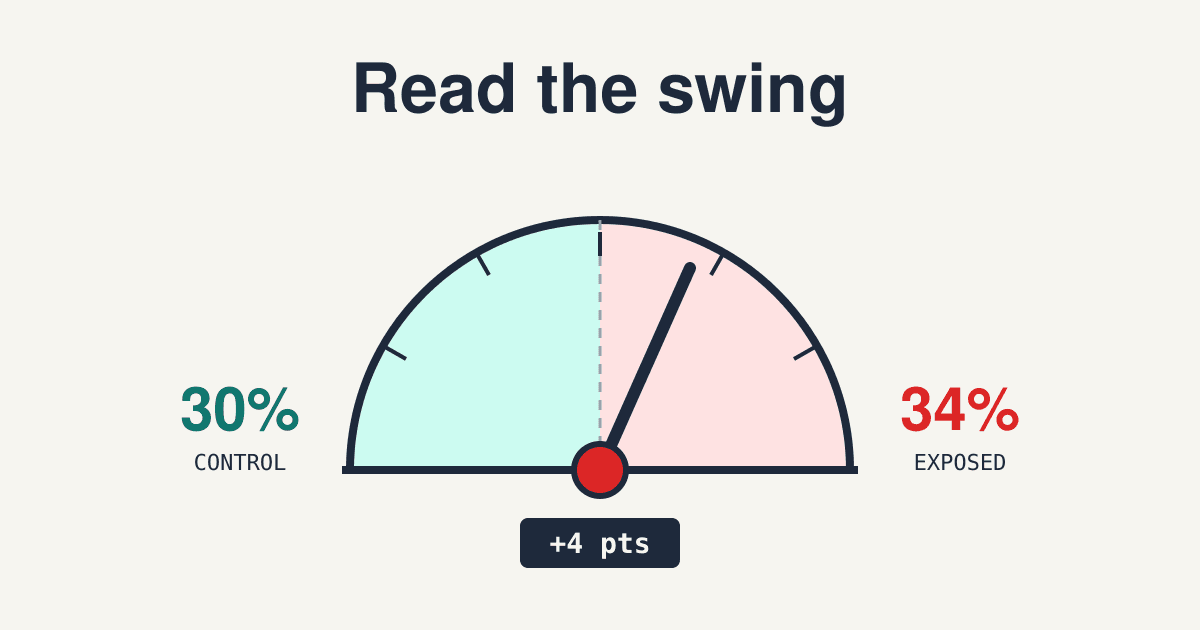
Our arithmetic: exposed 34%, control 30%, a 4-point gap. With 500 answers per group the 80% range runs from about 0.2 to 7.8 points. With 2,000 per group it narrows to about 2.1 to 5.9. The point estimate did not move; what you can say about it did.
Five ways a lift report gets misread
-
Leading with relative lift
A small brand with a 5% baseline that reaches 10% reports a 100% relative lift on a 5-point gap. Put absolute lift and the baseline in the same sentence every time you quote it.
-
Reading the dashboard on day three
Google says results can fluctuate during the study and recommends the final report. An early lift that fades is a sample that grew, not an ad that wore off.
-
Treating "no lift" as "no effect"
Below 50% certainty Google reports no lift, and says this does not mean the ads were ineffective; it may mean too few answers or a lift under 2 points. Its advice is to run a new test, not to cut the campaign on that result alone.
-
Crowning the segment with the highest certainty
Google warns against concluding that the segment with the highest certainty performs best: segments usually have overlapping intervals. Compare segments on absolute lift or cost per lifted user.
-
Reading attitude as sales
A consideration lift says people answer differently, not that they bought. For purchases, run a conversion or holdout test, covered in our guide to incrementality testing.
Brand lift questions buyers ask
Can a small advertiser run a brand lift study?
On Google, Brand Lift is not available to every account: Google says you need to contact a Google account representative, and without one you cannot use it (Google Ads Help, About Brand Lift). It also needs a video, audio or Demand Gen campaign that spends to a minimum budget shown in its eligibility calculator. Other platforms and survey vendors set their own entry rules; ask for them in writing.
How many metrics should one study measure?
Google allows up to three per study, and each metric needs its own responses. If the budget can only buy a few thousand answers, one well-chosen metric read with confidence beats three read as "not enough data".
Does survey language matter?
Yes. Google serves each survey in one language and says it should match the language of the ad; showing an English survey to all languages lowers the response rate. Split studies by language if the campaign runs in several.
How is this different from frequency and reach reporting?
Reach counts who could have seen the ad; a lift study asks whether seeing it changed an answer. Use both: our reach and frequency guide covers the first half.
Sources
- Google Ads Help, About Brand Lift (exposed and withheld groups, metrics, account availability)
- Google Ads Help, Set up Brand Lift (metric list, three-metric limit, survey answers, survey language)
- Google Ads Help, Lift measurement statuses and metrics (response table, 2,000, 4,100 and 16,800 thresholds, metric formulas, cost per lifted user example, control-group warning)
- Google Ads Help, About certainty of lift (certainty levels, 80% confidence intervals, segment comparison)
All pages were read on 2026-11-12. Thresholds are Google's for its own studies; other platforms and survey vendors publish their own, and none were checked for this post. The sample-size and confidence-range figures marked as our arithmetic use the normal approximation for two proportions.