Which week of the holiday season costs the most per sale: Black Friday week, when impressions are at their dearest, or the second week of December, when impression prices have mostly cooled?
The short answer
The second week of December. In Biddyco data from large US Meta accounts, consumer brands paid 35% more per 1,000 impressions in Black Friday week 2025 than in October, and still got purchases 20% cheaper, because shoppers were ready to buy. From December 8 to 14, impressions cost only 6% more, buyers had already bought, and each purchase cost 39% more than in October. Plan Q4 by cost per sale, not by CPM, and treat the weeks after Christmas as the cheapest of the year.
- +84% the median brand's CPM on Black Friday 2025 against its September level, in Lebesgue data.
- +39% cost per purchase from December 8 to 14, 2025, the worst week of the season for consumer brands.
- -24% CPM and cost per purchase from December 29 to January 4, against October.
Which weeks of Q4 cost the most?
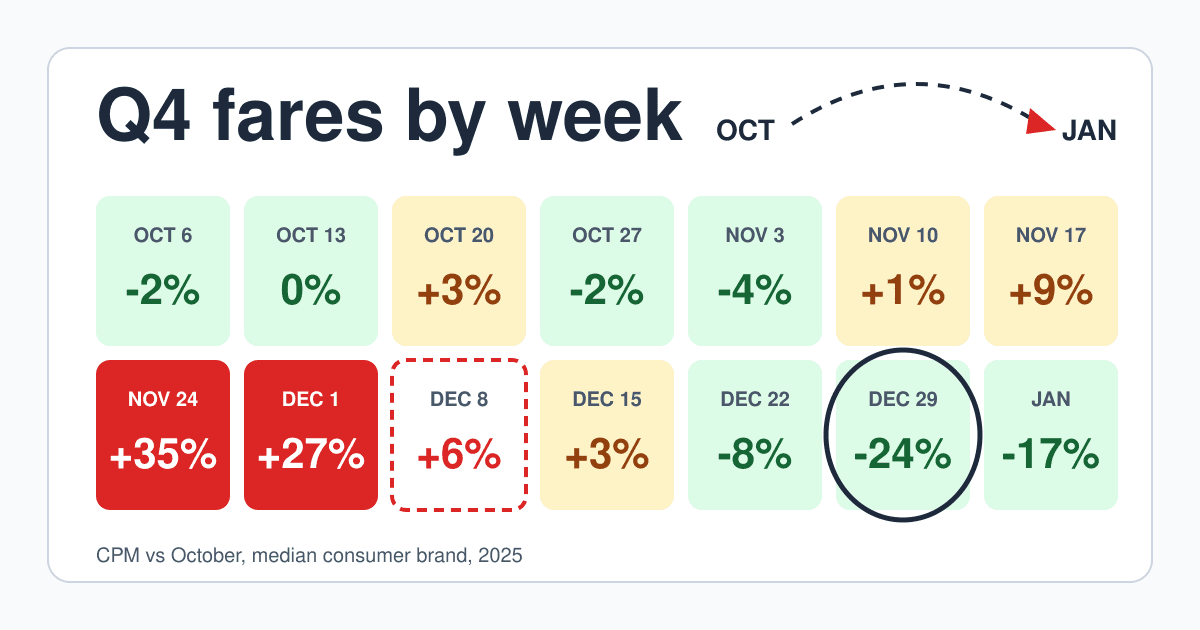
Costs held flat through October and early November, climbed from the week of November 17, peaked over Thanksgiving weekend and fell below October after December 21. Every figure below compares a brand with its own October 2025 average, as a median across large US consumer-brand accounts that each spent at least $30,000 that October, per Biddyco.
| Week of 2025 | CPM | Cost per purchase | Fare class |
|---|---|---|---|
| Oct 6-12 | -2% | +4% | Off-peak |
| Oct 13-19 | 0% | -3% | Off-peak |
| Oct 20-26 | +3% | -3% | Shoulder |
| Oct 27-Nov 2 | -2% | -1% | Off-peak |
| Nov 3-9 | -4% | -6% | Off-peak |
| Nov 10-16 | +1% | -7% | Shoulder |
| Nov 17-23 | +9% | -16% | Shoulder |
| Nov 24-30 (Thanksgiving, Black Friday) | +35% | -20% | Peak |
| Dec 1-7 (Cyber Monday) | +27% | -8% | Peak |
| Dec 8-14 | +6% | +39% | Overbooked |
| Dec 15-21 | +3% | +8% | Shoulder |
| Dec 22-28 | -8% | -26% | Off-peak |
| Dec 29-Jan 4 | -24% | -24% | Off-peak |
| Jan 5-Feb 1 (whole month) | -17% | -7% | Off-peak |
Fare classes are this post's labels: off-peak at or under October, shoulder up to 9% over, peak 10% or more, and overbooked for the week where cost per purchase ran 30% or more over October. Apps and services followed a different curve; see leg 4.
How much do the peak days add?
On single days the rise is far steeper than the weekly figure. Across the Thanksgiving to Cyber Monday weekend of 2025, Biddyco's consumer brands paid 30% to 57% more per 1,000 impressions than in October, while conversion rates rose far faster.
| Day of 2025 | CPM | Conversion rate | Cost per purchase |
|---|---|---|---|
| Thanksgiving, Nov 27 | +30% | +87% | -10% |
| Black Friday, Nov 28 | +57% | +226% | -42% |
| Saturday, Nov 29 | +57% | +88% | -16% |
| Sunday, Nov 30 | +45% | +71% | -22% |
| Cyber Monday, Dec 1 | +41% | +153% | -32% |
A second dataset, measured against September, shows the same shape with a higher top. Lebesgue found the median brand's CPM within 7% of September until the week of November 10, then:
On Black Friday the middle half of Lebesgue's brands paid 59% to 116% more than in September, and 90% of brands paid at least 10% more across the week. Costs fell fast after Cyber Monday and were still 20% over September on December 3.
What should you run in each kind of week?
Each class of week suits a different job. The costs are the 2025 consumer-brand figures from the calendar above.
-
Off-peak
October to mid-November, and December 22 to January
CPM 24% under to 3% over October
Prospect, test new creative and grow email and SMS lists while impressions are cheap. After Christmas, run new-year angles to the audiences that learned your name in November.
-
Shoulder
The week before Thanksgiving week
CPM +9%, cost per purchase -16%
Holiday offers should already be live and spending here, so the ad delivery system has data before the peak. Lebesgue and Biddyco both advise having holiday creative ready by late October or early November.
-
Peak
Thanksgiving to the first week of December
CPM +27% to +35%, cost per purchase -8% to -20%
For consumer brands, the best weeks of the year to spend, as long as stock and margin hold. Brands in Biddyco data raised daily spend 54% over October in Black Friday week.
-
Overbooked
The second week of December
CPM +6%, conversion rate -13%, cost per purchase +39%
Do not keep running Black Friday ads at Black Friday budgets. Switch to gift and shipping-deadline messages, or pull spend back until the week after Christmas.
If you buy reach rather than sales, the peak weeks are the dear ones: you pay the higher CPM without the conversion rise. Move awareness flights to the off-peak weeks and cap how often each person sees the ad, as set out in the reach and frequency guide.
Why will your own costs differ from these numbers?
Five conditions move the fare. Read them before you copy any percentage into a plan.
-
What you sell
Apps and services in Biddyco data saw CPMs rise only 16% in Black Friday week, 60% on Black Friday itself, and peak in the week of December 15 to 21 at +35%, with no matching rise in sign-ups. They run no Black Friday sale, so they pay the holiday price without the holiday buyers.
-
Your category
In Lebesgue data for Black Friday week, the median CPM rose 116% for home and decor, 76% for electronics and sporting goods, 66% for fashion and footwear, 42% for beauty, health and supplements, and 23% for other accessories and home goods. The groups are small, so read them as these brands, not market benchmarks.
-
The year
Lebesgue's same brands crossed 10% over September on October 14 in 2024 and on November 10 in 2025, four weeks apart. Black Friday week came in at +80% in 2024 and +59% in 2025. There is no fixed start date: plan for the rise to begin any time from mid-October.
-
The baseline
Biddyco measures against October, Lebesgue against September, and their stores differ, which is why Black Friday reads +57% in one and +84% in the other. Compare a vendor's holiday figure only with that vendor's own baseline, and your account only with itself.
-
The whole market
Prices also drift year on year. Meta reported that its average price per ad rose 6% in Q4 2025 over Q4 2024, while ad impressions rose 18%. A November that matches last November's CPM may still be dearer than your October suggests.
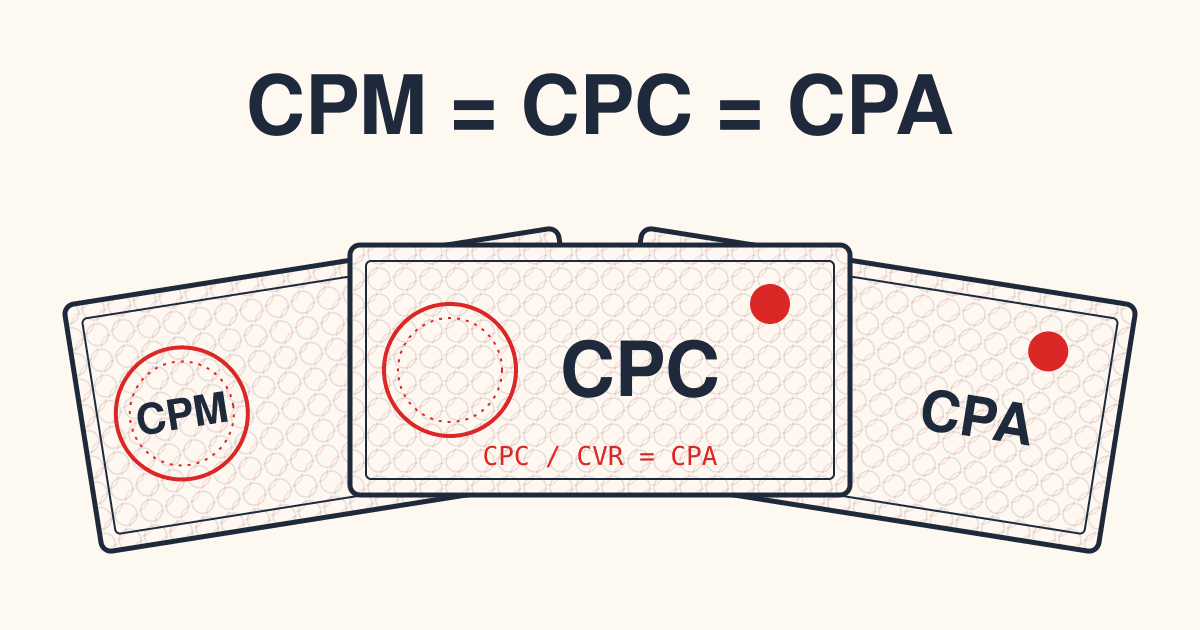
To turn a CPM rise into the cost per click or per sale it implies, use the price conversion guide.
A 2026 booking calendar, from today to January
In 2026, Thanksgiving falls on November 26, Black Friday on November 27 and Cyber Monday on November 30, one day earlier than in 2025. The stops below map the 2025 weeks onto those dates.
-
Nov 3 to 15
Get holiday creative live
In 2025 this stretch ran at October prices or under (-4% and +1%). Launch offer and gift ads now so they have spend history before the rise, and keep prospecting while it is cheap.
-
Nov 16 to 22
Watch your daily CPM
The 2025 rise started the week of November 17 (Biddyco) or November 10 (Lebesgue); in 2024 it started in mid-October. Compare each day with your own September or October.
-
Nov 23 to Dec 1
Spend into the weekend
Thanksgiving to Cyber Monday. Raise budgets as far as your break-even cost per sale allows, and check cost per purchase by the hour, not CPM.
-
Dec 2 to 6
Ease down
In 2025, costs stayed 27% over October through the first week of December, while cost per purchase held 8% under it.
-
Dec 7 to 13
Change the message or cut
The overbooked week. Run shipping deadlines, gift cards and last-order dates, or lower budgets.
-
Dec 14 to 20
Apps and services, take care
The most expensive week of 2025 for non-retail accounts, at +35% CPM.
-
Dec 21 to Jan 3
Buy the cheap weeks
CPMs dropped under October after December 21, and reached -24% from December 29 to January 4. Prospect, test and run new-year offers.
-
January
Reset baselines
January 2026 came in 17% under October on CPM. Use it as a cheap month, and as your new baseline for Q1.
What the same calendar means if you sell ad space
A buyer's fare is a publisher's income, so the calendar runs the other way for sellers. Mediavine calls Q4 the highest-earning quarter for its publishers, with CPM and fill rate surging in November and December, and January the lowest month for both, as advertisers have spent their year's budgets. It also sees brands spend less at the start of a month or quarter and more towards the end.
- Quote a separate Q4 rate for direct-sold slots, with the dates it covers, on your rate card.
- Sell January before December ends, as packages, while buyers still have this year's plans open.
- Read your own month-on-month drop in January against last January, not against December.
For buyers of direct placements the same pattern is a discount: Dupple reports newsletter slots selling 15% to 30% off in January.
Questions buyers ask about holiday pricing
Should I cut spend on Black Friday because impressions cost more?
Not on cost alone. In Biddyco data, consumer brands paid 57% more per 1,000 impressions on Black Friday 2025 and got purchases 42% cheaper than in October, because conversion rates more than tripled. Cut only if your own cost per sale goes over the level where you still make money.
Is a holiday price rise the same on every platform?
No. Both weekly datasets in this post come from Meta ad accounts. Publisher networks report the same direction for display, with CPM and fill rate surging in November and December and falling to their lowest in January, per Mediavine, but they do not publish the same weekly figures. Read your own platform reports for the size of the rise.
When are ads cheapest around the holidays?
In 2025, the week of December 29 to January 4: CPMs 24% under October and cost per purchase 24% under it too, for the median consumer brand in Biddyco data. January as a whole came in 17% under October on CPM.
Do direct-sold sponsorships get more expensive in Q4 too?
A flat fee does not move by itself the way an auction does, but sellers know their calendar. Dupple reports 15% to 30% off newsletter slots in July, August and January, when demand drops, so book January placements now if you want the off-peak price written down.
Which baseline should I compare holiday costs with?
Your own September or October, same account, same campaign type. Vendors use different stores and different baselines, which is why one reports Black Friday at +57% and another at +84%. Compare a vendor only with itself.
Sources
- Biddyco, Meta ads during Black Friday: CPM and CPA in 2025, large US accounts, October 2025 to January 2026
- Lebesgue, Meta ads on Black Friday, 2024 and 2025 seasons, median brand against September
- Meta, Fourth Quarter and Full Year 2025 Results, January 28, 2026
- Mediavine, Understanding seasonal ad revenue, updated August 4, 2025
- Dupple, Advertising in newsletters, 2026 rates